How to Predict If Your Flight Will Have Turbulence

Ever wanted to know in advance whether your flight would be subject to turbulence – and if so, when and how severe?
Without specialised tools, your best bet would normally be listening carefully to the pilot’s announcement before or after takeoff. If you can even hear it over the engine noise, that is.
But did you know that there’s a website where you can easily find detailed information about the weather conditions that will affect your flight up to 36 hours in advance?
Turbli provides turbulence forecasts to the public
Turbli.com is a completely free website that provides turbulence forecasts for any upcoming commercial flight, based on real-time weather information. Not only can it tell you whether to expect bumps en route, but it also predicts exactly how far into the flight to expect turbulence and how strong it will be.
Turbli can also tell you if you’ll be passing near any thunderstorms en route, as well as detailed wind information. This includes the expected crosswind during take-off and landing, as well as the predicted headwind or tailwind levels throughout the flight.

Using the wind information and comparing it to the average seasonal headwind or tailwind for the route, Turbli can even tell you if your flight is likely to arrive earlier or later than scheduled due to the winds.
It’s a useful and well-made resource for frequent (and/or nervous) flyers!
Turbli in action
For example, let’s look at this morning’s Qantas flight from Brisbane to Auckland. If we search on Turbli for flights from Brisbane to Auckland, it then gives us a list to choose from. Selecting QF119, we then see this:

Using real-time weather forecast information, Turbli can immediately predict that there will be a few bumps during the descent into Auckland. But most of the remaining flight will be smooth with just “light” turbulence. (The chart always shows some level of “turbulence” but bumps within the “light” range are nothing to worry about and would be barely noticeable.)
The estimated flight time takes into account the aircraft type and projected winds, among other things. The grey lines towards the start and end of the flight denote when the flight will reach cruising altitude and the top of descent, respectively.
Scrolling down on that same page for QF119, Turbli also provides information about the tailwind expected en-route:

And finally, whether to expect any thunderstorms and the level of crosswind expected for take-off and landing:

Overall, this flight looks like it will be quite comfortable during the cruise but just a bit bumpy on approach into Auckland.
While there are no thunderstorms expected today between Brisbane and Auckland, this evening’s QF7 from Sydney to Dallas may pass near a few storms en route. Overall, though, Turbli predicts that this flight will be relatively smooth.

World turbulence and thunderstorm maps
As well as information about specific flights, Turbli has maps showing turbulence and thunderstorm activity around the world. You can view real-time weather information, or see forecasts for the next 24 hours. You can even view the forecast turbulence at different altitudes!

Some routes are more prone to turbulence than others
The actual forecast turbulence on any route will vary from day to day. However, some routes are more prone to turbulence than others.
Turbli has aggregated data from commercial flights on over 150,000 routes in 2023, and used this to rank the most turbulent flight routes on average.
Obviously, routes that pass through areas of the earth prone to more intense weather are more likely to experience turbulence. But the routes with the highest average turbulence have something else in common: they all fly over mountain ranges.
Flights over irregular terrain, including mountains and manmade obstacles, often experience what’s known as mechanical turbulence. This is one of the four main types of turbulence an aircraft is likely to experience, and is luckily quite predictable.
The most turbulent flight routes
According to Turbli, these were the routes with the highest average turbulence last year:
- Santiago, Chile (SCL) to Santa Cruz, Bolivia (VVI)
- Almaty, Kazakhstan (ALA) to Bishkek, Kyrgyzstan (FRU)
- Lanzhou, China (LHW) to Chengdu, China (CTU)
- Nagoya, Japan (NGO) to Sendai, Japan (SDJ)
- Milan, Italy (MXP) to Geneva, Switzerland (GVA)
The world’s most turbulent route spends a lot of time flying over the Andes mountain range, which is a hotspot for mechanical turbulence. Airlines know this to be the case, so they always get passengers and crew to remain seated while flying in this airspace. On LATAM Airlines, there’s even a pre-recorded announcement advising of the expected turbulence while flying over the Andes.

Of the routes in the top five, I’ve personally flown from Almaty to Bishkek with Air Astana. That was a short flight over the Tian Shan Mountains. Due to the forecast turbulence and the short duration, all passengers and crew remained seated for the entire flight. That said, I don’t recall the turbulence being that bad.
You may also be interested to know that the long-haul route with the highest average turbulence is Tokyo-Kathmandu. And the most turbulent route within Australia is Brisbane-Sydney.
You can see the full lists on the Turbli website.
What can you do with this information?
There are lots of things you could do with information about the forecast turbulence for your upcoming flight. For example, if you knew there would be a strong headwind making the flight take longer, you could anticipate a late arrival.
You could plan when you will work or sleep during the flight. Or if you knew there would be strong turbulence an hour prior to landing, you might expect that tea and coffee won’t be served in the meal service before arrival.
But for aviation geeks like myself, it’s just generally interesting information.
Other public resources for predicting turbulence
There are other resources that can also predict the weather, winds or turbulence you’ll experience en route. One such website is Turbulence Forecast.
There’s also Windy, which shows real-time jet stream maps:
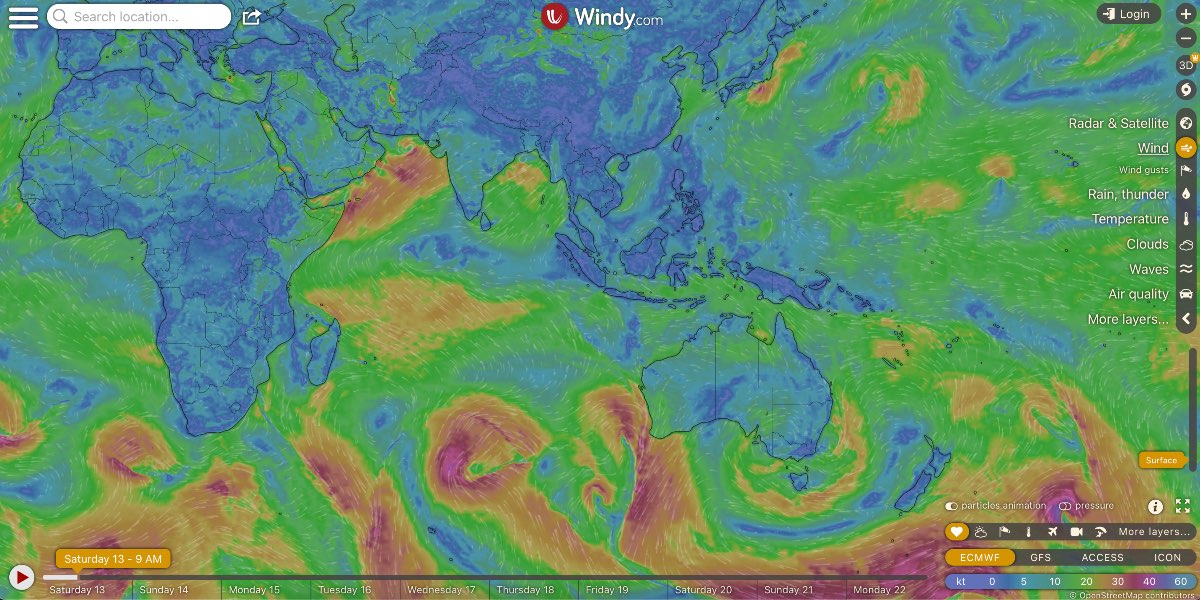
But Turbli seems to be the most user-friendly for people who aren’t pilots, giving you all the information you need in one place.
If you’re wondering how accurate Turbli is, you may be interested to know that its creator is an engineer with a PhD in Computational Fluid Dynamics. So, he knows a thing or two about this stuff!
Related Articles
-
 22 May, 2024In Flight
 -
 25 September, 2020In Flight
 -
 25 March, 2019In Flight
Community Comments
Loading new replies...
Join the full discussion at the Australian Frequent Flyer →