What Carbon

Status
Not open for further replies.
Of course it is. But I cannot for the life of me imagine any sensible estimator that would follow a uniform distribution.

There are a few situation were it is valid. Also worth remembering that the quoted number is not based on a single estimator. Well that's my assumption that it isn't the change at one location only.
 
There are a few situation were it is valid. Also worth remembering that the quoted number is not based on a single estimator. Well that's my assumption that it isn't the change at one location only.

If it's a single estimator, then a uniform distribution would mean it assigns an equal probability of being the true mean to any value within the interval (and also that probabilities taper off dramatically and mysteriously outside that interval), which makes it by definition the most useless estimator possible.

If the sum/average of multiple estimators accumulated through the literature looks like it follows a uniform distribution, then you have too much noise for any talk of an interval to be meaningful.

Anyway, all of the above is pointless... all you have to say is that given any reasonable degree of symmetry and a mean-centered distribution (i.e. pretty much any sensible estimator), there will be a greater weight on a positive outcome in the above example.
 
This thread is far more interesting than Carbon/AGW/GW/Politics ;)
 
drron - you are like a breath of fresh air. Ok ... that is possibly an exaggeration, but at least you are coherent.

I am not privy to the full details of this working party (as you seem to be) so can you please quote the summary where this figure is published. Just to get the context. If this is too onerous for you then a link to the document will do fine.


BTW - I don't make personal attacks, just don't hold back on lies and stupidity.

I have provided the link before.I am travelling and my travel device does not have the info stored.It is on my home PC.

I don't care what you think.I consider most of your replies to me personal attacks.
 
Medhead there you go again assigning meaning to my replies that is clearly incorrect.I did not say that it is equally correct to say the earth as cooled but that there is a chance that it has cooled in the last 10 years.
 
If it's a single estimator, then a uniform distribution would mean it assigns an equal probability of being the true mean to any value within the interval (and also that probabilities taper off dramatically and mysteriously outside that interval), which makes it by definition the most useless estimator possible.

If the sum/average of multiple estimators accumulated through the literature looks like it follows a uniform distribution, then you have too much noise for any talk of an interval to be meaningful.

Anyway, all of the above is pointless... all you have to say is that given any reasonable degree of symmetry and a mean-centered distribution (i.e. pretty much any sensible estimator), there will be a greater weight on a positive outcome in the above example.

Yes, if it is a single estimator. An example I recall is a set of paired measurements, to compare technique were each pair was not a measurement of the same thing. It all depends on the in lying dataset.

In any case, there is modelling of both natural and man-made factors that match the observed temperatures, which say temperature based on natural factors alone should be lower by more than -0.05 degrees. That's the problem with presenting numbers in isolation. They often don't mean what people hope they mean.
 
One of our six new solar systems produced a $1200 electricity saving in 28 days so the paybacks are running in the range of 2.5 to 3 years at our warehouses seeing we mostly work sunlight hours.
We may double size the systems next winter if we can overcome some major red tape imposed by the electricity generators in various States. Each system is 30kW and 60 kW would take a big hunk of our carbon emissions out.
Doing a bit is better than asking " What can one person do?"
 
The Aral Sea has dried up completely for the first time in 600 years.
Satellite images show Aral Sea basin 'completely dried' | World news | theguardian.com
Hmmm ...

Fish Are Finally Returning to the Shrunken Aral Sea | VICE United States
...
The Aral Sea is actually a saltwater lake that once covered an area of 26,300 square miles between Kazakhstan and Uzbekistan. Today, it is a shadow of its former self, having split into northern and southern halves in 1986. The sea first began to shrink in the 1960s when the Soviet Union decided to divert the rivers that feed into the sea to irrigate cotton fields further south. Cotton was one of the main economic industries in Soviet times, and Moscow’s planners clearly prioritized economic growth over any environmental concerns. ...
 
Wow..... You guys are still going??!!??!!??


Sorry gotta go..... Time to apply more sunscreen
 
... What this has to do with the carbon tax and more generally global warming is beyond me. Please explain.
I was wondering the same thing myself, pointing out why it was quite dry.

I guess you will have to ask of whatmeworry why the Aral sea post in the first place.
 
The Frequent Flyer Concierge team takes the hard work out of finding reward seat availability. Using their expert knowledge and specialised tools, they'll help you book a great trip that maximises the value for your points.

AFF Supporters can remove this and all advertisements

pause111111_thumb.jpg


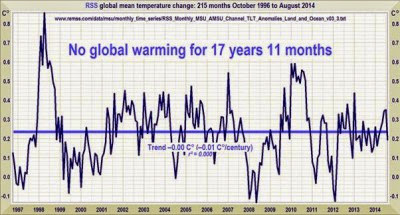
So the trend in earth temperature over the last 215 months is exactly 0.00C.
 
Sponsored Post

Struggling to use your Frequent Flyer Points?

Frequent Flyer Concierge takes the hard work out of finding award availability and redeeming your frequent flyer or credit card points for flights.

Using their expert knowledge and specialised tools, the Frequent Flyer Concierge team at Frequent Flyer Concierge will help you book a great trip that maximises the value for your points.

pause111111_thumb.jpg


So the trend in earth temperature over the last 215 months is exactly 0.00C.

Leaving aside that your starting point conveniently includes an extreme peak year, what do you mean by the term "earth temperature"? What measurement is this exactly?
 
Leaving aside that your starting point conveniently includes an extreme peak year, what do you mean by the term "earth temperature"? What measurement is this exactly?

Not sure what your point is.The graph did not start with an extreme warm year.if it did the trend for global temperatures would be negative.And if 1998 hadn't occurred the trend again would be negative.
 
Status
Not open for further replies.
Back
Top